
Identifying structure
with your cmor card

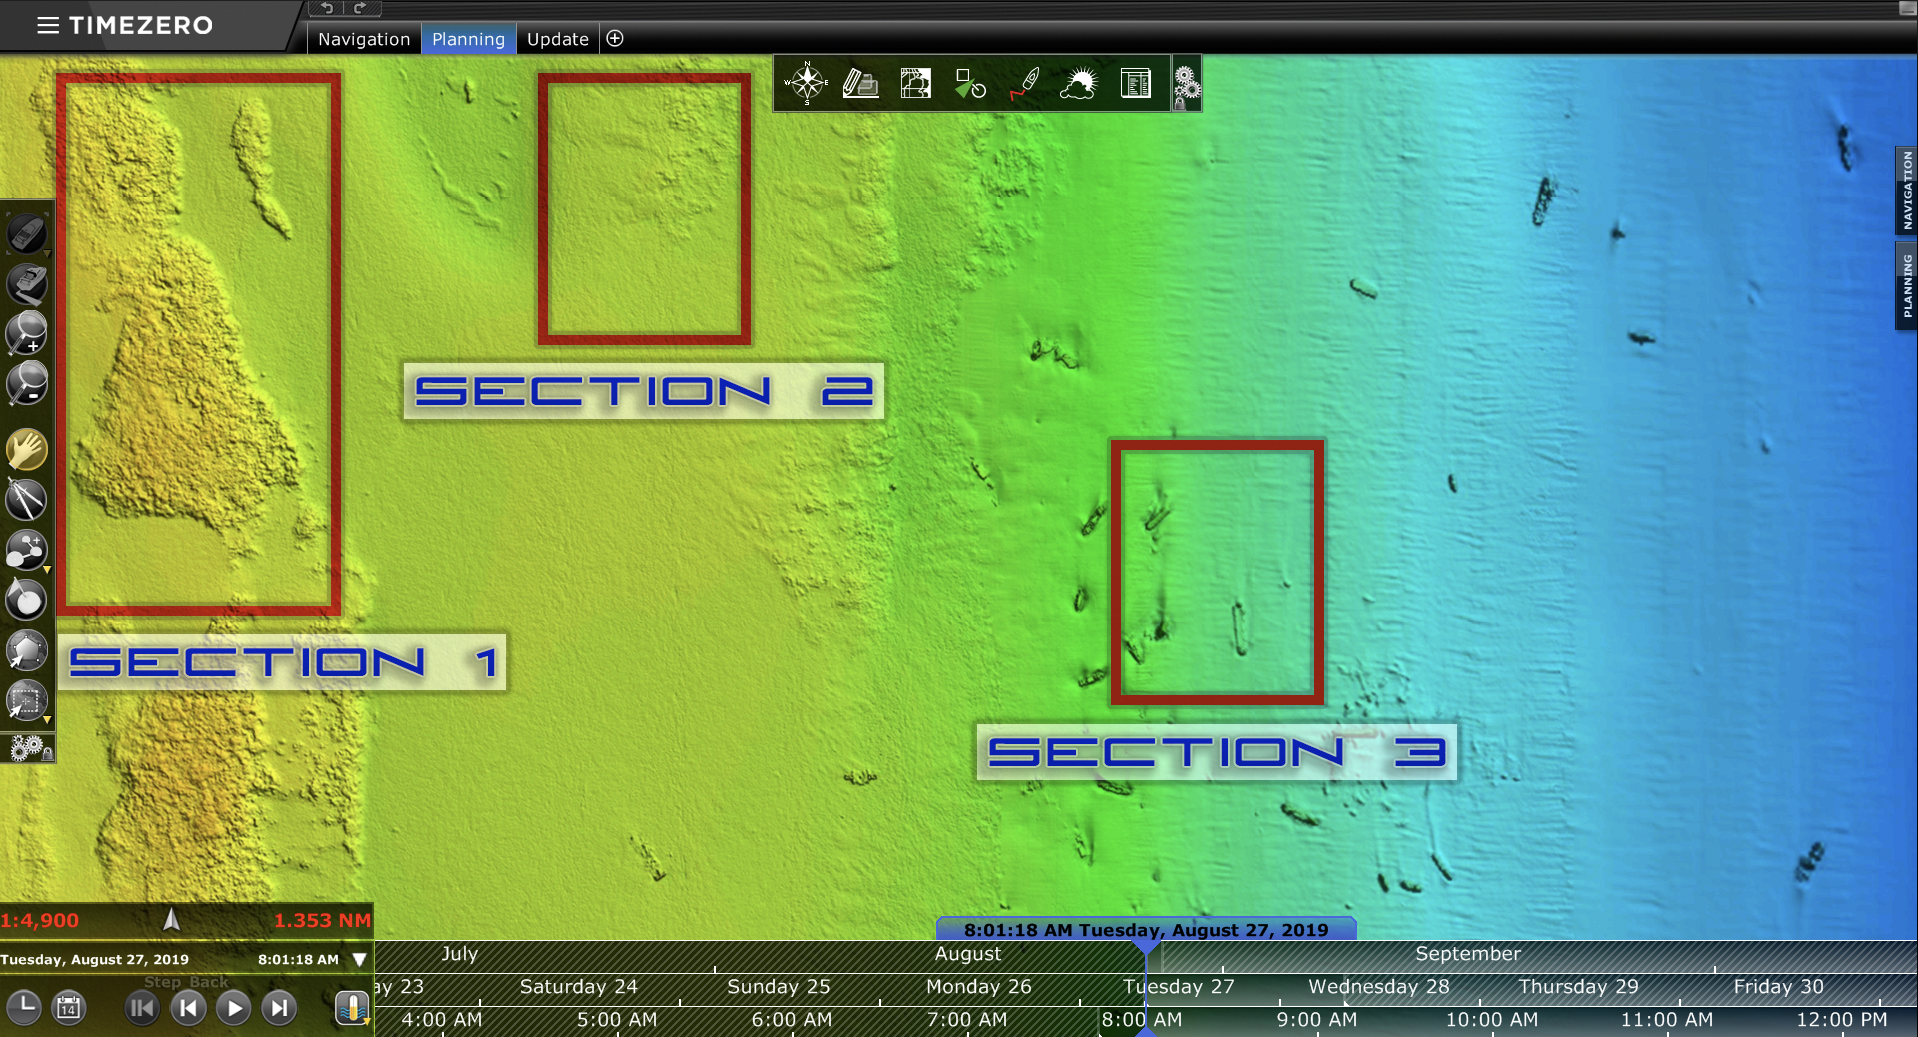
+ SECTION 1
Section 1 showcases a reef. The orange is the top of the structure (shallowest part by color ranking) and you can see black shading outlining a natural shape, with black spots on top outlining holes. This is a great way to identify a hard bottom.
+ SECTION 2
Section 2 showcases a bottom has a similar look the the reef in section 1 but is more consistent with a yellow/green color. This means it does not have a dramatic change in depth, but looks to share a similar visual to the reef which can be identified as a hard bottom.
+ SECTION 3
Section 3 showcases wrecks. You can see the black shading gradually fades to the north without the presence of black spots like section 1. This appears to be a softer bottom with the current pushing north.